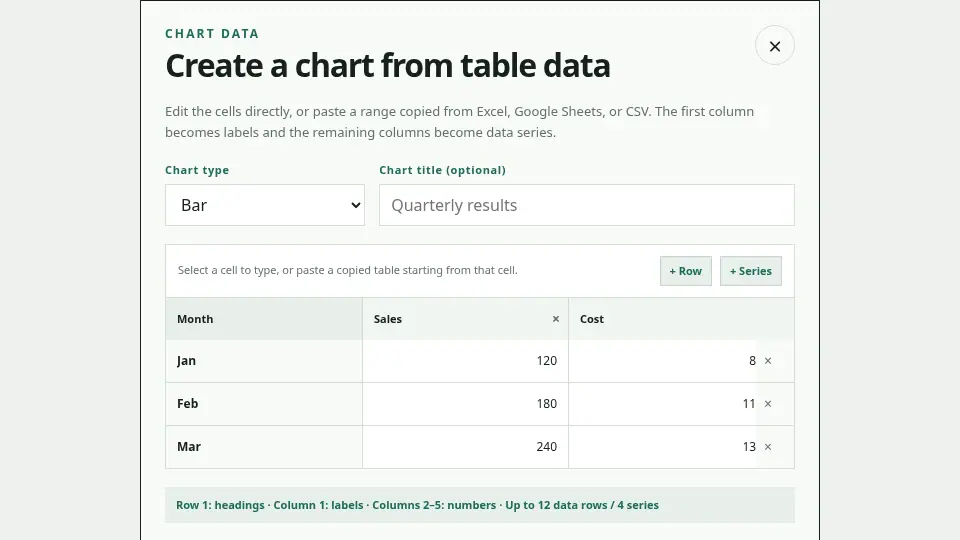
Paste a cell range as-is
Copy a range including its headers from Excel or Google Sheets. Open Chart below the editor, select the top-left cell, and paste. Marplio expands the range while preserving rows and columns. The first row becomes series names, the first column becomes labels, and the remaining cells are treated as numbers.
Correct the cells after pasting
Every pasted cell remains directly editable, and you can adjust rows and columns before inserting the Chart. Keep units and notes out of numeric cells, then resolve blank headers or rows and series beyond the current limits. CSV and tab-separated text can be pasted into the same grid.
Raw spreadsheet data stays in the browser
Marplio converts pasted CSV or tab-separated data into Chart JSON in your browser. It does not send the raw table to an API, database, Analytics, or Google Sheets API. The inserted Chart syntax becomes the source stored in the Deck.